
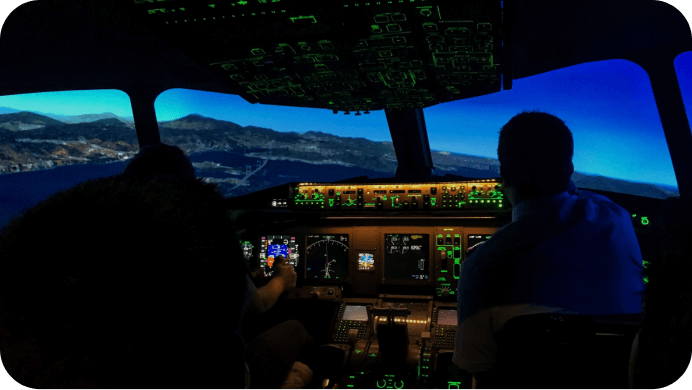
Travel & aviation technology
Unleash new possibilities
Putting power back into the hands of airlines

One agile tech stack
Flexible, modular products, underpinned by cutting-edge technology. Works for any airline as a ‘one-stop’ or bespoke solution and integrates with any system.

A fresh perspective
Our approach is born from deep travel experience and unconventional thinking. Our core belief is that airlines should have more control over their technology.

Built on solid foundations
Our technology is proven with over 185 airline customers already.

190+
Global airlines
96
Travel integrations
120MUSD
Incremental revenue
99.9%
Platform stability (Uptime)
Meet GO7
Ready for take-off?
The runway is set.
Our teams are passionate about travel which makes this journey personal. We’re inspired to work together and drive real change.
Our solutions
The power of the GO7 travel platform


Our products
Discover our ecosystem
Unlock agility with today’s product suite that puts the power back in the hands of airlines.

W2 GDS Sub-hosting
Facilitating GDS sales has never been easier. Outsource all the set up and complexity to us and we’ll distribute your tickets on the GDS on the airlines behalf.

Network
GO7 Network connects you to appear on OTAs, meta-searches and different aggregators all over the world at the click of a button.
Proven Results
Hear from our customers
We’re a customer-centric company so who better to tell you about our services.
Airlines all over the world use GO7 to empower their business, and fuel their growth.
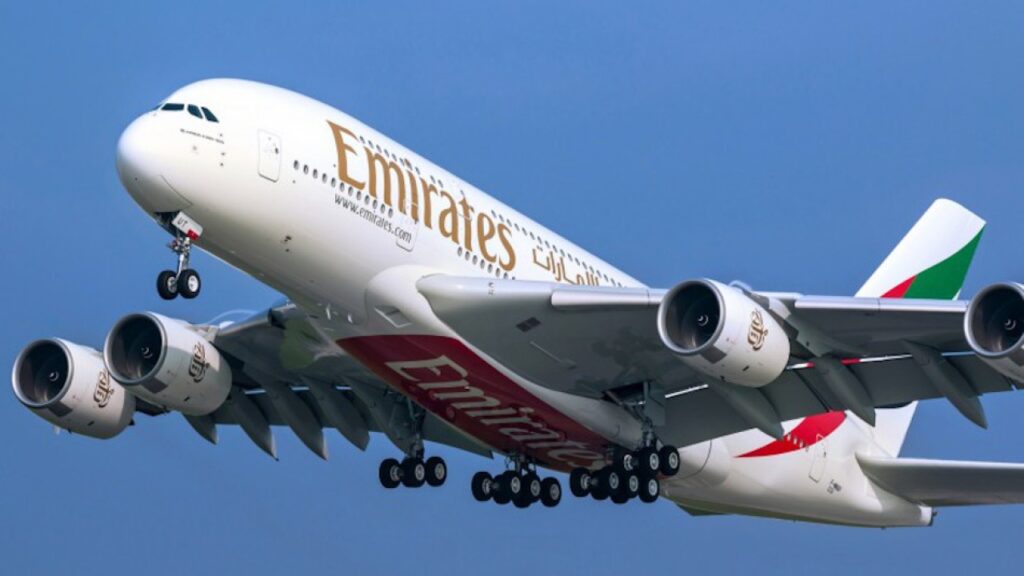
“We are pleased to deepen our partnerships with Icelandair and GO7. Their networks and intermodal capabilities complement our European presence, providing an array of connections for our customers to simplify their journeys. Together, we will open up new travel opportunities, and more choice for customers wishing to travel across Europe. We believe that these partnerships will bring real benefits to our customers and business, and we’re taking positive steps towards further strengthening our relationships in the future.”
Adnan Kazim, Deputy President and Chief Commercial Officer, Emirates Airline
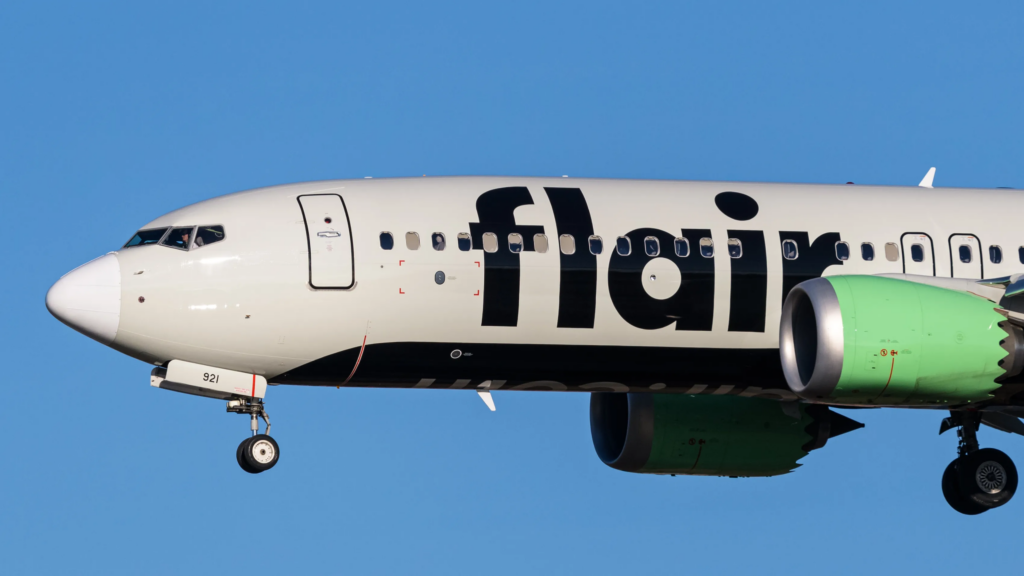
“As an ultra-low-cost airline, our business model relies on keeping our expenses low. GO7’s innovative and no-complexity approach to expansion is exactly what our airline needs to grow. Working with GO7 enables us to identify new revenue streams as we broaden our route network and connect more travelers here at home and across the globe to the joy of traveling in Canada and beyond.”
Garth Lund, Chief Commercial Officer of Flair Airlines
“From implementation to training and development of new features, it has been an absolute pleasure working with the GO7 team to bring our vision for LIFT to life. It’s felt like we have another department within our existing team rather than a separate business supporting us.”
Jonathan Ayache,
CEO, Lift Airline
“Multichannel distribution is important as it goes hand-in-hand with our network expansion plans for summer 2023. Thanks to our marketing partnership with GO7 and its global distribution technology, Aeroitalia services are now closer to the travel agency community to the benefit of our customers.”

Krassimir Tanev, CCO, Aeroitalia
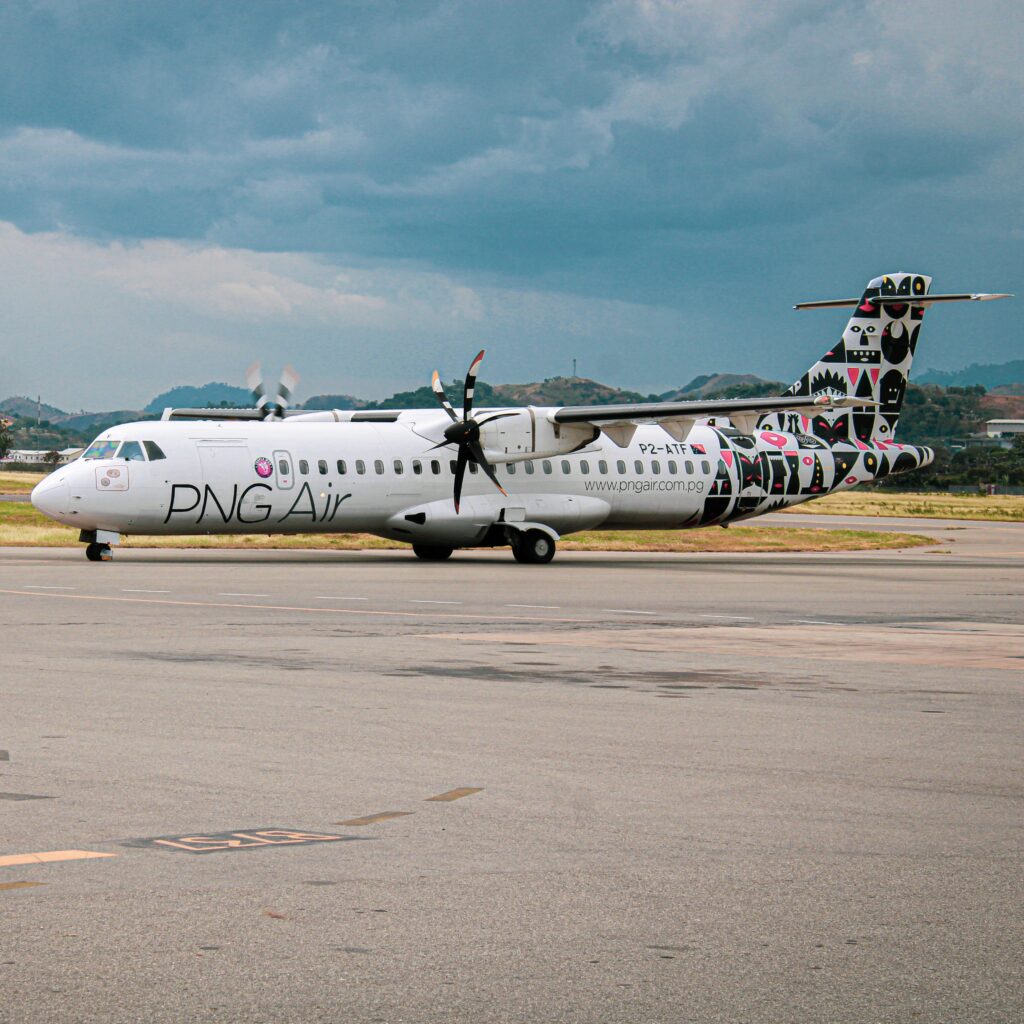
“PNG Air is excited to partner with GO7. For a regional carrier, GO7’s Global BSP Ticketing solution is a winner, helping to optimise GDS sales in non-strategic markets through their global reach, enabling travel agents all over the world to issue PNG Air fares on W2-365 documents, which the airline could not achieve on its own.”

Simon Pitt, Chief Commercial Officer of PNG Air
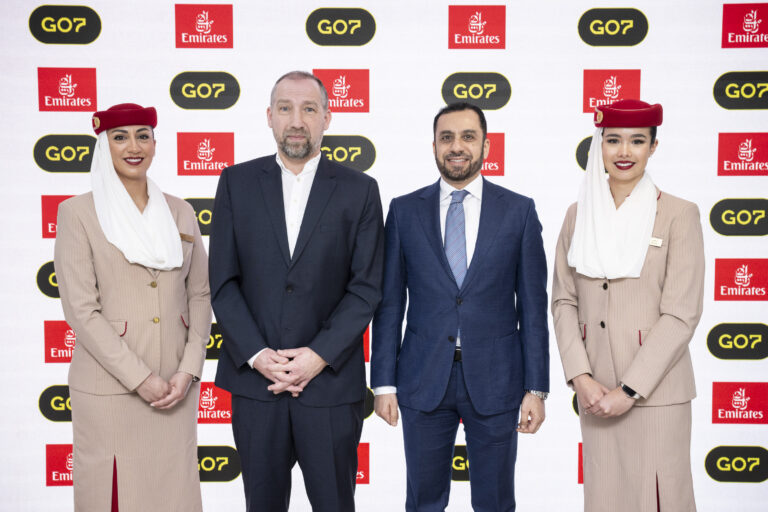
Emirates signs MoUs with Icelandair and GO7 with plans to develop deeper cooperation

A Year in Review

Enhancing Airlines’ Reach and Revenue: Kiwi on GO7 Network
Air Century Achieves Successful Integration with GO7 to Expand Global Connection

Plus Ultra Líneas Aéreas partners with GO7 to broaden sales capability
ITA Airways enters partnership with W2 by GO7 for a new intermodal product with Deutsche Bahn AG

Flair Airlines Partners with GO7 to Support Growth and Expand Market Reach

Bringing aviation in line with other consumer-facing industries